Graph the equation \(y=x^2-5\) for \(x\)-values between \(-5\) and \(5\text{.}\)
Clear the output history: In the Algebra View (see the
Note above if the Algebra View is closed), tap the kebab menu icon (three vertical dots) in any existing history line, and select Delete. (If the menu does not apppear, you may wish to review the
Note from the previous section.)
In the input box, enter \(x\text{,}\) then tap the squaring key, - \(5\) ⮠.
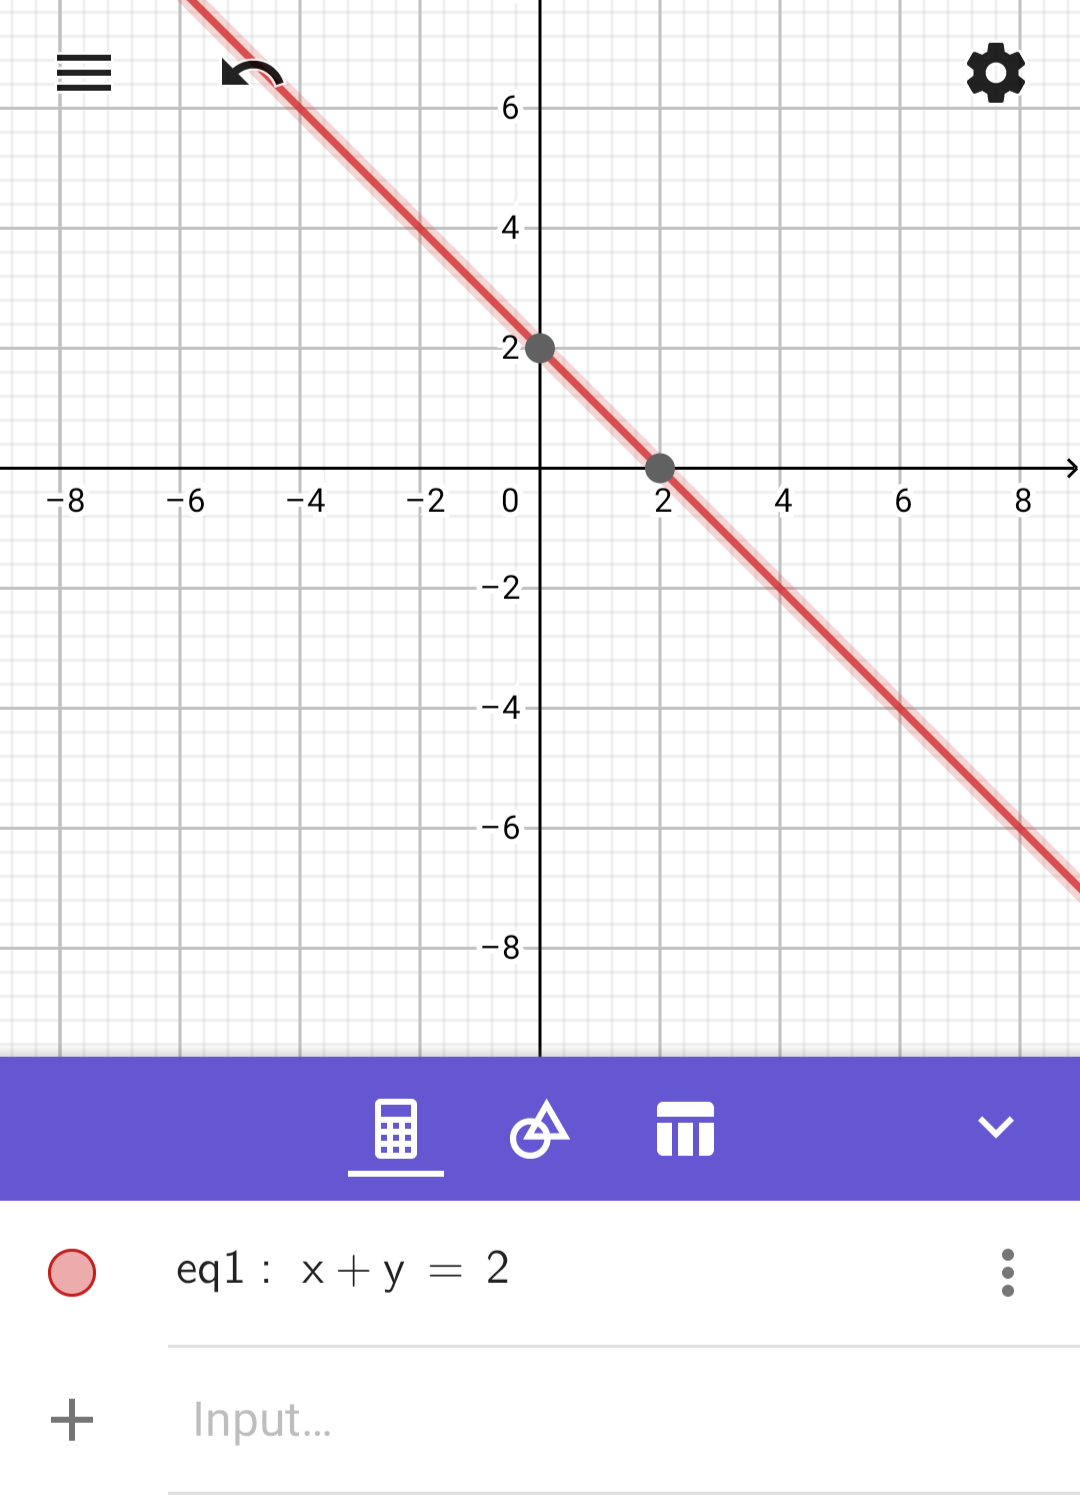
The output history shows
\begin{equation*}
f(x)=x^2-5
\end{equation*}
and the Graphics View shows the parabola.
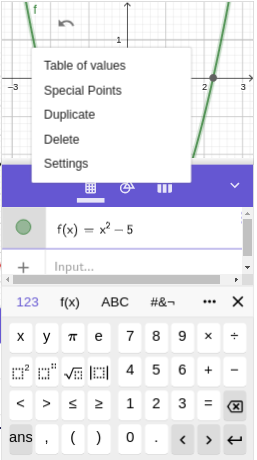
Tap the kebab menu icon (three vertical dots) in the output history line, and select Table of values.
Set the Start value for \(x\) to \(-5\text{.}\) Set the End value for \(x\) to \(5\text{.}\) Set the Step value to \(1\text{,}\) then click OK
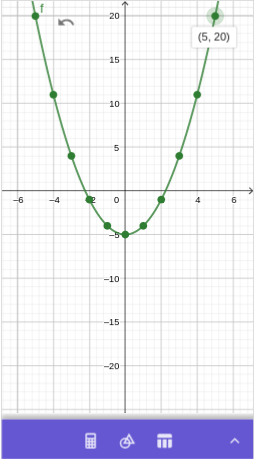
Click on the arrow key at the right edge of the border between the Algebra View and the Graphics View to hide the Algebra View and enlarge the Graphing View. Tap on any of the dark dots on the graph to see its coordinates.
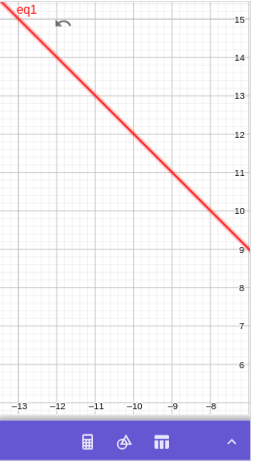
We zoom out just enough so that both \(x=-6\) and \(x=6\) are both visible on the \(x\)-axis. Now we zoom out just the \(y\)-axis (until \(y=20\) is visible) as follows.
On a touch screen, we pinch vertically on the \(y\)-axis.
On a computer, we move the cursor above the \(y\)-axis until the cursor looks like a hand. Then holding down the Shift key, we click (the cursor changes again to an arrow pointing up to a horizontal segment), and drag down.
The points \((-5,0)\) and \((5,0)\) are now visible in the Graphics View.